2022-11-14 · Fantasy basketball
Finding the Best Elo for Our Fantasy League
Twenty-five ways to rate a fantasy league, scored against eight seasons of real matchups. Originally an email to my league from the 2022–23 season, so “this season” and every number below are as of then.
Over the last 5 years of my commission-ship of this league, I’ve been collecting and distributing the Elo ratings for our league. What is Elo, you might ask? Well, here’s the short explainer.
This rating system was invented to work for chess, as there’s no real “score” in a chess game. I wanted to do a deep dive to see if we can learn anything from these ratings as they change over the years. This season’s analysis is going to be three main pieces. We’ll start by analyzing which Elo is “best”, more on that later. Second we’ll do a gambling based analysis. If Vegas set odds for our fantasy league, what would they be? How much money would you make? And finally I’ll show you what we can see from whichever graphs I have churned out.
Methodology
I’ll start the methodology section by explaining what I mean by finding the best Elo. The expected score of a matchup comes from running both players’ ratings through this formula, where R is each player’s rating:
If E is greater than half, then that team is expected to win. But what happens after the match? We need to adjust the ratings to reflect the results. Let’s take a look at the formula for how ratings are adjusted:
Where S is a player’s score. As you can see, K shows how sensitive the rating is. The higher the K factor, the more each match contributes to the next rating. For our league, I use the actual category score instead of a 1 or 0 to indicate whether someone wins or loses. However, we can also look at it as a binary win/loss, or trinary with ties added in to be more precise. Now let’s go back to that K factor. Honestly when I picked it out to begin with, it was 40. I saw a bunch of different numbers suggested from my initial research, and decided on the higher one. Then in year 3 I decided to up it to 60 to make it more volatile, as I didn’t feel like keeping a consistent rating for each manager from season to season. So I wanted to take a look at what possible values for K did for the accuracy of the rating.
Even if this weren’t a redraft league, we’d have to think about how to adjust the ratings in the offseason. 538 brings every rating 40% closer to the mean (1500) every off season, but why not explore the options and see how big a swing we should make it? Looking at off-season adjustments of 0%, 20%, 40%, and 60%, as well as K factors of 20, 40, and 60 and splitting things out by the two scoring methods, trinary and true score, gives us 24 different combinations of ratings and adjustments. I also included our normal K = 60 with off-season reset as another data point so we can see how the error from the resetting rating behaves over the season in comparison to the other ratings. Including offseason adjustments, that’s 177 weeks of 23 players’ data, which gives us 101,775 Elo ratings across the 866 different matchups we’ve seen. Throughout, I’ll be referring to systems by two numbers in a set of parens like this, to denote the K factor and off-season adjustment: (k, osa). They’ll all be true score unless otherwise noted.
The big question is simple: how do we evaluate these rating systems? By its predictive value, of course! We’ll compare the difference between expected score and true score for each of the 25 systems we have in order to see which is the most accurate. We should also try to find out if this is a “good” way of predicting who wins by comparing it to other methods of prediction. The simplest is random chance. Is our rating system better than flipping a coin? Other ideas would be based on who has the most wins between the competitors. I added two columns for all-time wins and seasonal wins. So if Neil has 5 wins and Alex has 3, the predicted score would be .625 for Neil, who has ⅝ of their total wins. The 8 seasons we’ve spent on the Yahoo! platform give us a lot of different ways to slice and dice the data, and I’ll be able to give you a great idea of how these different systems perform over time.
Results
| rank | system (k, osa) | RMSE |
|---|---|---|
| 1 | Default (60, full reset) | 0.161929 |
| 2 | (60, 20) | 0.162152 |
| 3 | (60, 40) | 0.162815 |
| 4 | (60, 60) | 0.163906 |
| 5 | (20, 20) trinary | 0.163976 |
| 6 | (40, 20) | 0.164181 |
| 7 | (40, 40) | 0.164627 |
| 8 | (20, 40) trinary | 0.165284 |
| 9 | (40, 60) | 0.165412 |
| 10 | (60, 0) | 0.167098 |
| 11 | (40, 0) | 0.167828 |
| 12 | (20, 60) trinary | 0.168272 |
| 13 | (20, 20) | 0.168852 |
| 14 | (20, 40) | 0.168941 |
| 15 | (20, 60) | 0.169159 |
| 16 | (20, 0) | 0.169958 |
| 17 | (40, 20) trinary | 0.172866 |
| 18 | (40, 40) trinary | 0.175879 |
| 19 | Blind (always 0.5) | 0.178815 |
| 20 | (40, 60) trinary | 0.181229 |
| 21 | (20, 0) trinary | 0.183775 |
| 22 | (60, 20) trinary | 0.186816 |
| 23 | (60, 40) trinary | 0.190356 |
| 24 | (60, 60) trinary | 0.196233 |
| 25 | (40, 0) trinary | 0.202010 |
| 26 | (60, 0) trinary | 0.217317 |
| 27 | Season wins share | 0.230287 |
| 28 | All-time wins share | 0.292304 |
As you can see, the best performing Elo rating by RMSE is… the one I’ve been running with all along! Way to go me. We see some patterns looking at the rankings, but two seem to be at odds with the rest of the rankings and specifically each other. For example, we usually see the 0 OSA ranked last, but 20 ranked first when controlling for k and scoring. In fact, as OSA goes up so does error, completely at odds with the default being first. Secondly we usually see lower k and trinary score both leading to higher error. Which makes the 5th ranked (20, 20) trinary so fascinating.
Breaking it down by year gives us the most relevant result. Over time, the default Elo that we’ve been running with has performed better.
| season | lowest-error system |
|---|---|
| 2014 | Default |
| 2015 | (60, 0) |
| 2016 | (60, 20) |
| 2017 | (20, 20) trinary |
| 2018 | Default |
| 2019 | Default |
| 2020 | Default |
| 2021 | (20, 40) trinary |
Breaking it down by week, you see the (60, 0) pop up a lot. Fascinating to see the trinaries pop up later on in the season, but default and (60, 0) clearly reign supreme.
| system (k, osa) | weeks it had the lowest error |
|---|---|
| Default | 3, 7, 9, 12, 15 |
| (60, 0) | 13, 14, 16, 18, 19, 21 |
| (20, 20) trinary | 1, 6, 20 |
| (40, 20) trinary | 2, 10 |
| (40, 40) trinary | 4, 5 |
| (60, 40) | 11 |
| (20, 60) trinary | 17 |
| (40, 60) trinary | 23 |
| Blind (always 0.5) | 0, 8, 22 |
This graph is even more interesting to look at:
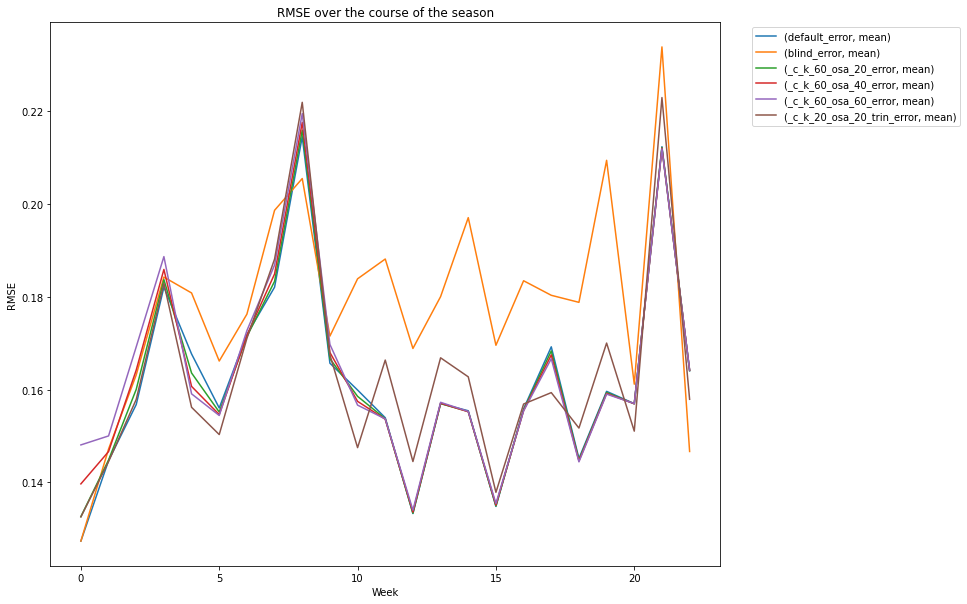
We have the blind error there to compare, as it gives us a perspective on how much the RMSE for the week is due to the average score differential that week. If the average score differential is low, then blind predictions will have a low RMSE. I ended up excluding Weeks 23 and 24 from the graph because of how much they skewed the scale. This is partially thanks to John and Neil’s tie, but also to the competitive nature of this league and how close our playoff matchups end up being. It’s fascinating to see how close the Elo systems all tend to be. It seems like through the middle of the season the Elos perform significantly better, but close matchups in the playoffs are hard to predict.
The comparisons to just randomly guessing are quite fascinating. Randomly guessing outperformed looking at historic and season wins. It’s surprising to see how many weeks straight up guessing was the most reliable, especially late in the season or playoffs. But it seems part of that is due to the scores of those matches. The more common a 5-4 score is, the lower the error for randomly guessing. For the next iteration, I might try to simulate random guesses with 0s and 1s instead of .5.
So uhhh how do we use all this to determine gambling odds? Well, find out next time.
→ The Elo System project, the package these ratings grew into